The right SIEM tool varies based on a business’ security posture, its budget, and other factors. However, the top SIEM tools, such as LOGTITAN, usually offer the following capabilities:
1. Scalability — Ensure the solution can accommodate the current and the projected growth.
2. Log compatibility — Ensure that the solution is compatible with your logs.
3. Correlation engine — Does the solution have the ability to search across multiple devices and logs?
4. Forensic capabilities — Does the solution offer forensic analysis capabilities from the event source?
5. Dashboards — The solution must provide the ability to easily create dashboards and reports.
6. Threat intelligence — Find out if the solution can integrate with internal/external intelligence sources.
7. Compliance Reporting.
8. Incident response.
9. Machine Learning — Can the system improve its accuracy through machine learning and deep learning?
10. Performance.
Scalability
LOGTITAN can scale into any organization — big or small, locally-based or operating globally. LOGTITAN “Hierarchical Master-Slave Model” manage events in a distributed manner for offloading the processing requirements of the log management system for tasks such as collecting, filtering, normalization, aggregation. This model also is a solution for security-related issues and an incremental approach. The main advantage of the “Hierarchical Master-Slave Model” is easily extendable and scalable by adding regional SIEM implementations. [1]
Log compatibility
SIEM functions based not just on its correlation rules but on the data you feed it. Feeding your SIEM security-related data results in more accurate alerts.
Currently, most of the SIEM products support hundreds of log formats. If there is a log format that is not supported, there is an API for custom log parser. LOGTITAN has a nearly 500+ supported device.
Correlation engine
SIEM use cases or rules are the %80 of the value of the product. Check the predefined rule list for the product and also check are there any restrictions. A Next-Gen SIEM correlation engine will be very helpful to analysts indeed. Not all SIEM correlation rules, use cases are created equal and it is hard to find a SIEM that supports both core, advanced and intelligent use cases at an affordable price[16,17,18].
All the SIEM products have correlation capabilities but not all SIEM solutions are created equal. Detailed analysis required to understand the difference between correlation capabilities. For example, most of the SIEM solutions have a watchlist or list management feature, but only some of them and LOGTITAN have multidimensional list management capability in correlation [14]. Some solutions like LOGTITAN update multiple lists, set at the same time while others do not.
Correlation and detection methods and correlation features diversity are important like detecting what never seen before and many others. LOGTITAN can play a huge role in making analysts’ jobs easier with many modern detection and correlation features like never seen before type of rules[18].
Advanced features like:
· Never seen type of rules
· Trend rules
· UBA rules
· Anomaly detection rules
· Change comparison rules
· List management
· Taxonomy rules
are the key features for a successful detection. They are all supported by LOGTITAN.
Sample distinguishing use cases supported by LOGTITAN:
• Returns days where a user accessed more than his 95th percentile number of assets
• Look for a user whose HTTP to DNS protocol ratio is %300 more than %95 of the other users for the last four-week ratio for 4th day of week
• If a user number of failed authentication ratio to the number of successful authentication is %10, alert
• Data loss detection by monitoring all endpoints for an abnormal volume of data egress
• Measures the similarity between well-known process names with the running ones using Levenshtein distance in real-time and detect process masquerade
• DGA detection
• Failed login to an asset that a user has previously never logged on to
• First time user is performing an activity from a country
• First VPN connection from a device for a user
• First connection from a source IP
• First access to a device for a user
• First access to database MSSQL for peer group HR
• First access to database MSSQL for user
• First mail to/from a domain for the organization
• First access to this web domain which has been identified as risky by a reputation feed
• First execution of a process on a host
• First access to object fdghsdydhas
• First access from a host to a database for a user
• First access from source zone Atlanta office to a database for a user
• Suspicious temporary account activity
• Abnormal account administration
• Unusual account privilege escalation
• Unusual file modifications
• Abnormal password activity
Forensic capabilities
Almost every company needs a solution for protecting its sensitive data and detecting suspicious activity in real-time. Besides, when an incident occurs, companies want to be able to provide digital evidence in the courtroom. Integrity is also critical. This is usually achieved by using integrity mechanisms, such as running hash checks on blocks of stored log data. Historical log data must be secured either with a checksum in the form of a popular hash — MD5, SHA1, SHA2, etc. — or with a digital signature.
Easily aggregate and search logs within a single platform is critical.
The latest study by the Ponemon Institute on behalf of IBM found that the average time required to identify a data breach is currently 197 days [15]. So having logs under hands at least 197 days is a good plus and makes everything easy for detection and forensic analysis. It is achieved by live search capability. Disk usage for live search is the most critical parameter. Every SIEM solution has its own technology with advantages and disadvantages for live search. Some examples:
- IBM QRadar:
How much space is used per day in bytes can be calculated with the following formula: [eps rate] * ([AveragePayloadSize in bytes] + [AverageRecordsSize in bytes]) * 86400 [2]
- Splunk:
You can estimate how much index disk space you will need for a given amount of incoming data. Typically, the compressed raw-data file is 10% the size of the incoming, pre-indexed raw data. The associated index files range in size from approximately 10% to 110% of the raw data file. The number of unique terms in the data affect this value [3].
- McAfee ESM:
Due to the number of enabled standard indexes on McAfee ESM, you can add only 5 indexes to an accumulator field. If you need more than 5, you can disable up to 42 unused standard indexes (such as sessionid, src/dst mac, src/dst port, src/dst zone, src/dst geolocation).
McAfee ESM uses standard indexes to generate queries, reports, alarms, and views. If you disable an index, McAfee ESM notifies you when it can’t generate a query, report, alarm, or view due to a disabled index, but it does not identify which index is disabled. Due to this limitation, do not disable standard indexes unless needed [4].
- ElasticSearch (Lucene Based Solutions)
You can estimate how much index disk space you will need for a given amount of incoming data.
disk space used(original) = 1/3 original for each indexed field + 1 * original for stored + 2 * original per field with term vectors [5].
- AlienVault:
Alienvault USM All-in-One has a limit of 200 million events in its database. There are not more than 200 million events in the Alienvault USM All-in-One SIEM database [6,7].
- LOGTITAN:
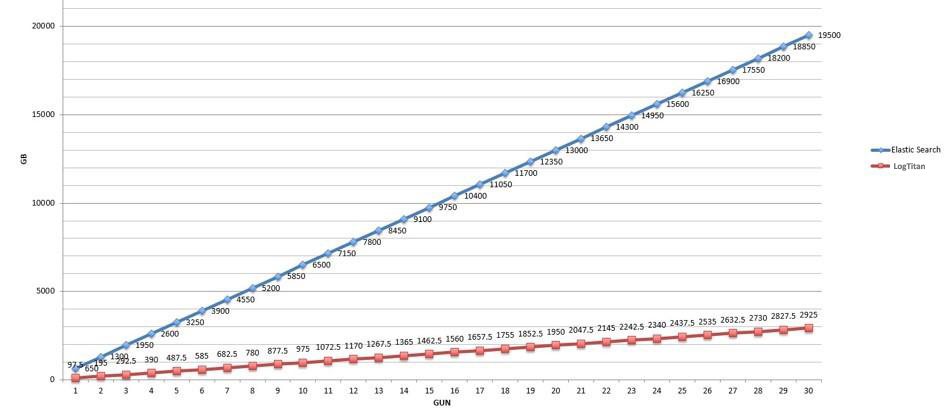
LOGTITAN compresses indexes. Compressing indexes give LOGTITAN the advantage of live search, real-time search capability for years. An example of a LOGTITAN disk capacity requirement of a live search for 5000 EPS for one year is 5 GB. LOGTITAN live search disk usage performance is the best among competitors. When LOGTITAN disk usage for live search compares to Elasticsearch and Lucene based systems, the result depicted in the below graph. It is shown that LOGTITAN compress much more than Elasticsearch and Lucene.
Dashboards
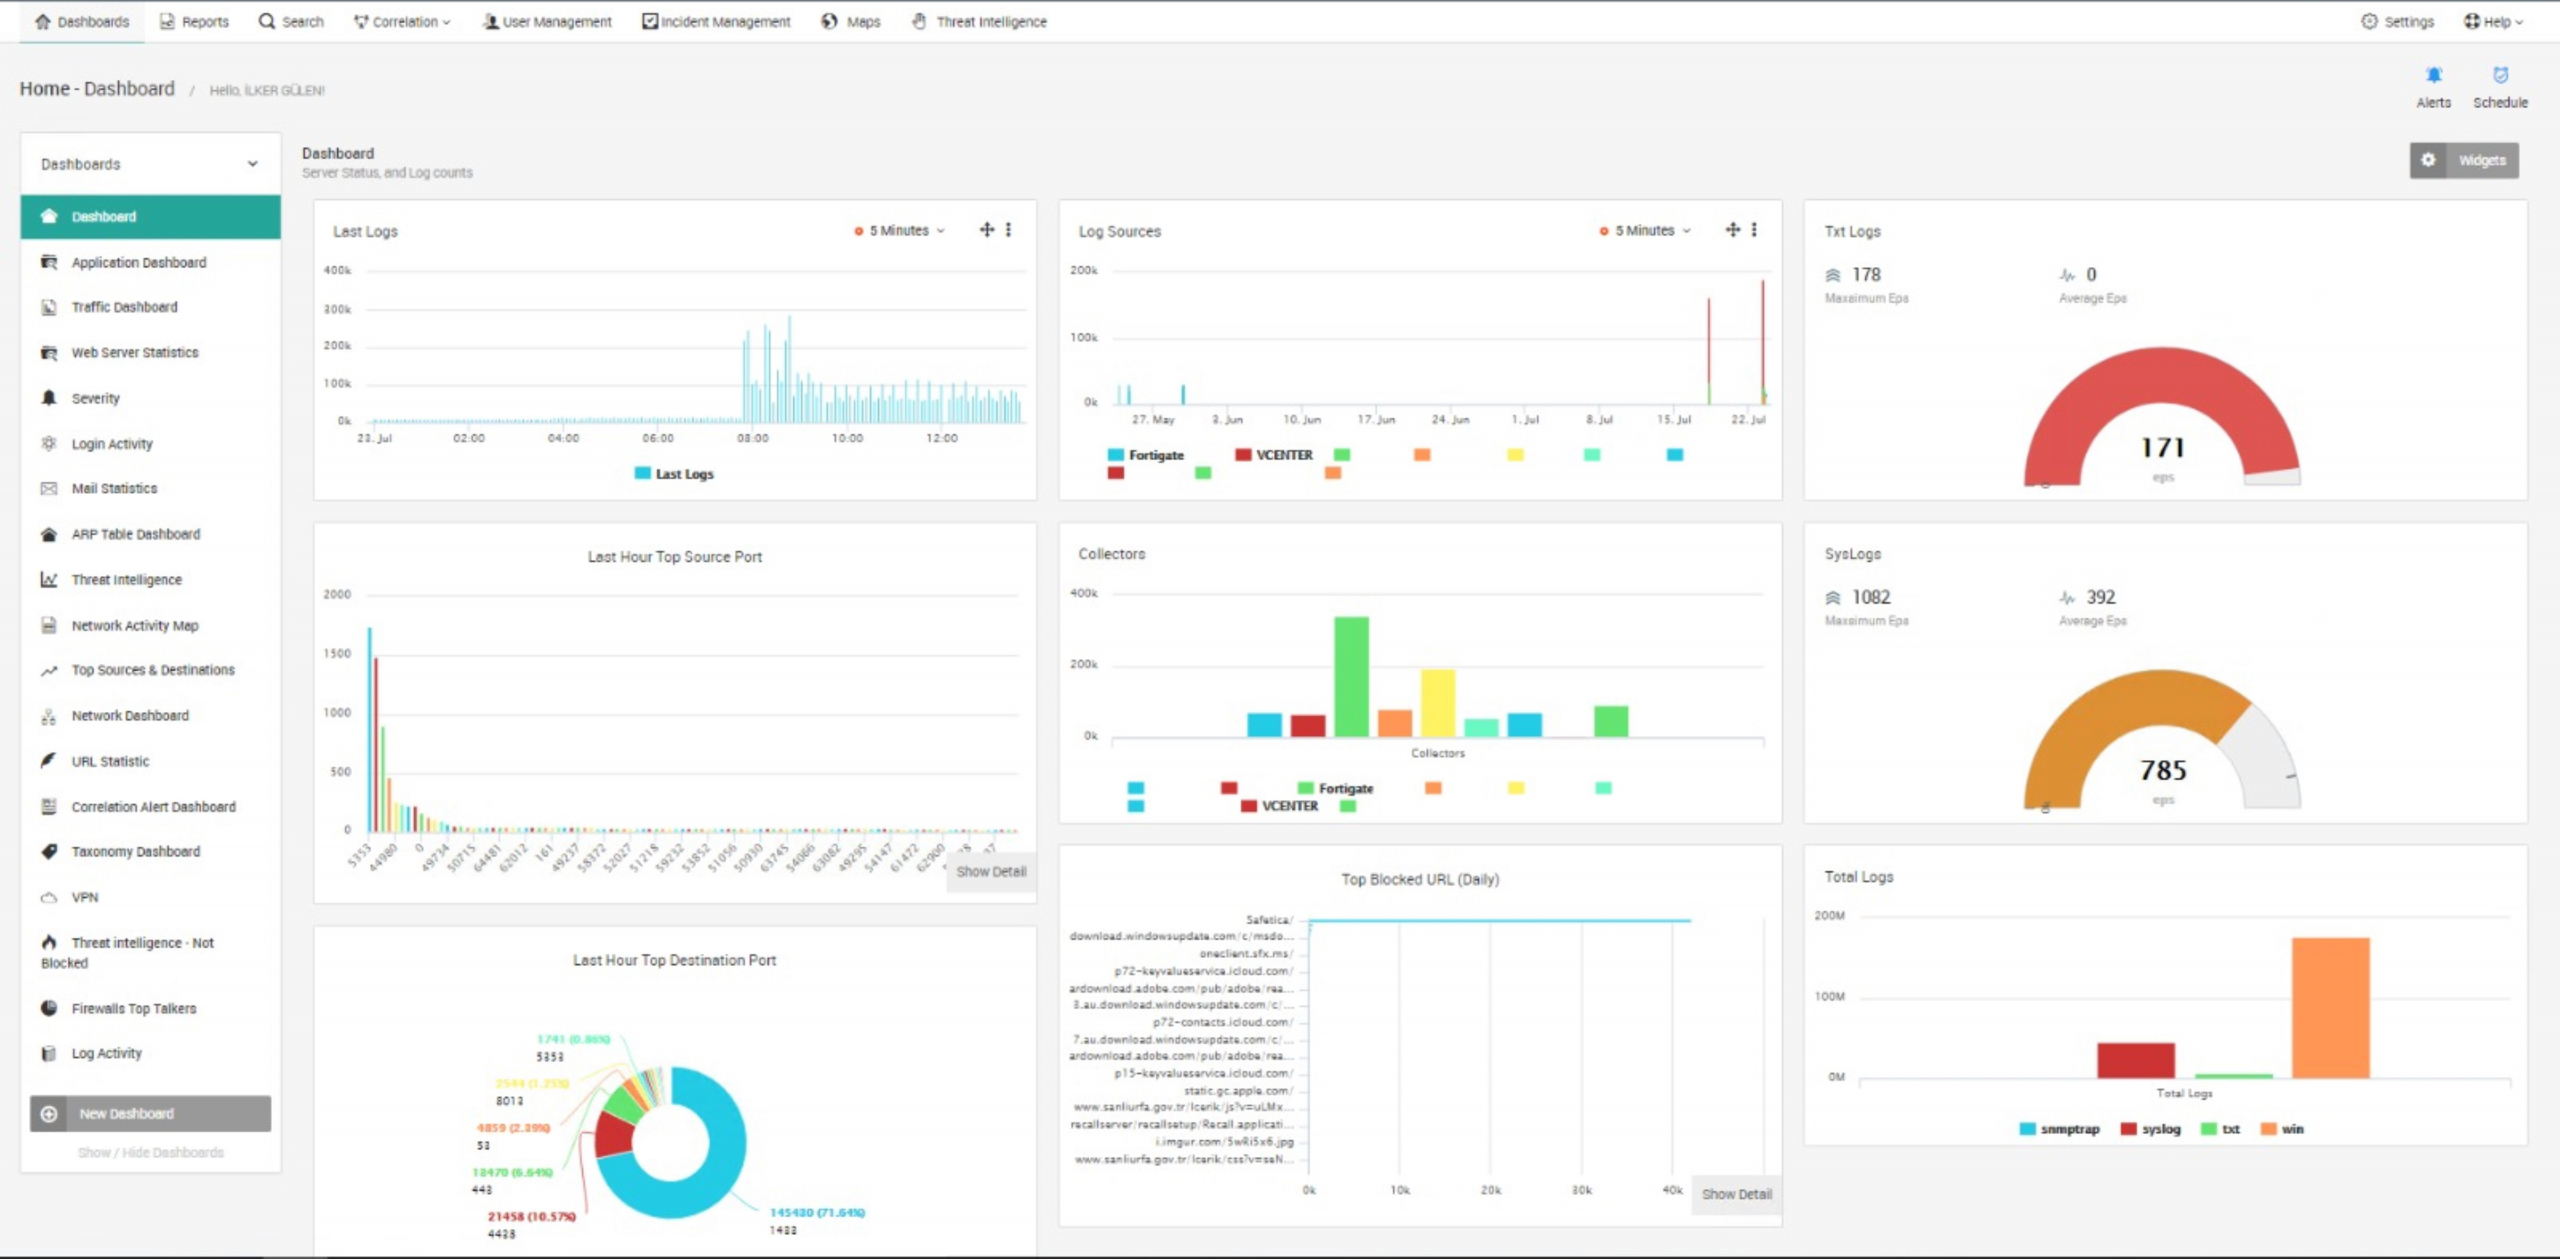
Real-time monitoring and dashboards permits visibility at the desired level via security-based, pre-defined and customizable analysis.
In addition, you can create real-time and easy reports by preparing dashboards and widgets which are appropriate for your new ad hoc requirements.
The LOGTITAN application features dashboards on various security topics. Dashboards deliver monitoring and reporting metrics to track the state of security throughout the network. These are simple to configure and user friendly while allowing users to read a summary of existing network infrastructure data using graphs and tables [8].
Threat intelligence
Threats are dynamic and attack vectors change constantly. Respond quickly and minimize damage by using the rich external context enabled by threat intelligence. Immediately know about dangerous IP addresses, files, processes, and other risks in your environment.
LOGTITAN combines multiple threat intelligence feeds and generates alerts for the benefit of the security team. LOGTITAN uses this data to reduce false-positives, detect hidden threats, and prioritize your most concerning alarms.
Compliance Reporting
Regulatory compliance is necessary. SIEM will help to save time and ensure compliance with predefined reports. Creating a productive SIEM environment requires plenty of predefined reports you need on a daily, weekly or monthly basis and also easy to create reporting infrastructure [8].
LOGTITAN has more than 1400 predefined reports and very easy &fast reporting infrastructure [8,18].
Incident response
Incident response is an action that SIEM takes in response to suspicious activity or an attack. Active response actions include the Block IP active response, the Disable Networking active response, the Logoff User active response, the Kill Process active response and so on. LOGTITAN also supports to execute any executable file as a response with parameters from detection rules [9]
Machine Learning
Machine learning in SIEM takes cybersecurity rules and data to help facilitate security analytics. As a result, it can reduce the effort or time spent on rote tasks or even more sophisticated duties. With the right configurations, machine learning can actually make decisions based on the data it receives and changes its behavior accordingly. LOGTITAN has many ML models [10,19,20,21,22,23,24].
Some of the ML models used by LOGTITAN:
- Detecting tools used by cybercriminals
- Hunting critical process masquerade
- Hunting malware and viruses by detecting random strings
- Domain generation algorithm (DGA) detection
- Profiling user and entity behavior
Performance:
The performance analyses of SIEM products are very important in terms of evaluation.
The running performance of SIEM products, the resources which they require (CPU, RAM, DISK) and how they will show performance in the EPS value needed is very important. There are two kinds of evaluation parameters:
· Limits and recommendations
· Requirements
Many SIEM products documented limits and recommendations like:
- AlienVault:
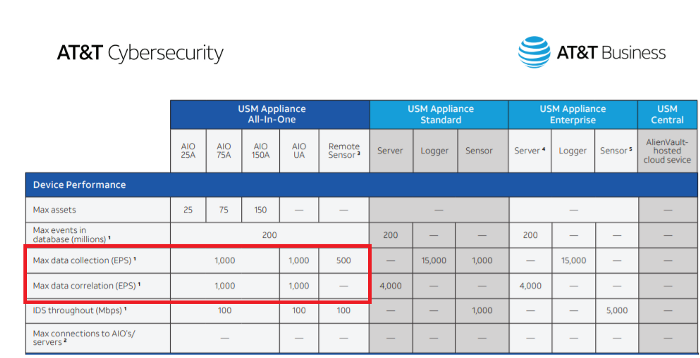
AlienVault USM Appliance All-in-One has 1000 EPS data collection and 1000 EPS correlation limits or restrictions [6,7]
- Solarwinds LEM
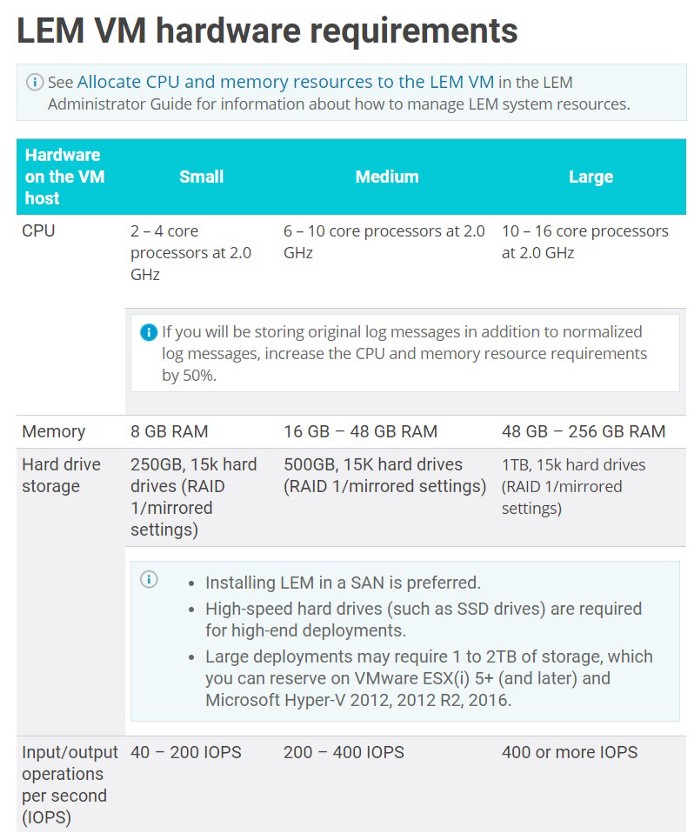
A properly configured LEM can handle up to 200 million events per day, or 2,500 EPS (events per second). Conversely, limiting the ‘reservations’ (appropriate CPU and RAM) will result in poor performance and instability. While the maximum EPS limit is 2500 EPS the requirement for 2500 EPS is 48–256GB Ram 16-CPU @2Ghz [11].

- McAfee
Maximum Ingestion Events Per Second (iEPS) describes peak advertised EPS for this appliance. iEPS is based on out-of-box settings with no adjustments to default event or flow aggregation and very Stilted overall SIEM user activity (Users, Alarms, Reports, loCs, etc.). Any customization in the configuration or increase in user activity may result in reduced observed EPS rates [12]. Maximum Ingestion Events Per Second (iEPS) is 1500 for VM version of McAfee SIEM [12].

There is no limits on LOGTITAN architecture.
All of the SIEM tools has system requirements like:
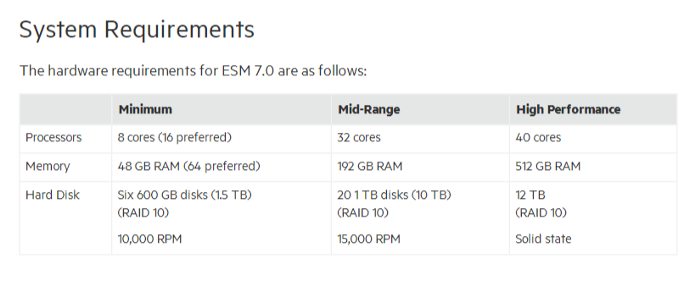
- Arcsight
System requirement for Arcsight [13]
- LOGTITAN
System requirement for LOGTITAN is 16 core, 32 GB Ram for max 2500 EPS with 100 rules enabled.
References
- https://solutionsreview.com/security-information-event-management/the-3-most-common-siem-mistakes-and-how-to-avoid-them/
- https://www.ibm.com/support/pages/qradar-how-determine-average-event-payload-and-record-size-bytes-updated
- https://docs.splunk.com/Documentation/Splunk/8.0.0/Capacity/Estimateyourstoragerequirements
- https://docs.mcafee.com/bundle/enterprise-security-manager-11.0.0-installation-guide-unmanaged/page/GUID-2F189D5A-AC92-4965-80A4-03EE2272F37C.html
- https://lucidworks.com/post/estimating-memory-and-storage-for-lucenesolr/
- https://cdn5.alienvault.com/docs/data-sheets/usm-appliance.pdf
- https://success.alienvault.com/s/question/0D50Z00008oGqax/alienvault-v571-functional-release
- https://searchdatacenter.techtarget.com/feature/14-SIEM-reports-and-alerts-to-boost-security
- https://logrhythm.com/products/features/smartresponse-automation-plugin-library/
- https://www.ibm.com/us-en/marketplace/qradar-user-behavior-analytics
- https://documentation.solarwinds.com/en/success_center/LEM/content/System_Requirements/SEM_2019-4_system_requirements.htm
- https://community.mcafee.com/t5/Security-Information-and-Event/Mcafee-SIEM/td-p/617728?lightbox-message-images-617737=2991i122AF2F454808D73
- https://community.microfocus.com/t5/ArcSight-User-Discussions/ArcSight-VM-ESM-System-requirement/td-p/2687370
- https://www.ibm.com/support/knowledgecenter/SSKMKU/com.ibm.qradar.doc/c_qradar_adm_ref_data_collection_overview.html
- https://www.all-about-security.de/fileadmin/micropages/Fachartikel_28/2019_Cost_of_a_Data_Breach_Report_final.pdf
- https://www.logtitan.com/blog/logtitan-ng-siem-most-valuable-siem-use-cases/
- https://www.logtitan.com/blog/27-logtitan-siem-use-cases-examples-for-threat-detection/
- https://www.logtitan.com/never-seen-before-type-of-rules/
- https://www.logtitan.com/logtitan-siem-and-advanced-threat-analytics-with-machine-learning/
- https://www.logtitan.com/user-behavior-analytics-module-uba/
- https://www.logtitan.com/blog/domain-generation-algorithms-detection-in-logtitan-ng-siem/
- https://www.logtitan.com/blog/critical-process-masquerade-detection-in-logtitan-ng-siem/
- https://www.logtitan.com/blog/hunting-malware-by-detecting-random-strings-in-logtitan-ng-siem/
- https://www.logtitan.com/blog/detecting-4-most-commonly-used-hacking-tools/
